1. What is probability?
It is the chance of something happening. It can be between 1(possible) and 0(impossible).
2. What are mutual exclusive events?
We can’t get both heads and tails in one times its called mutual exclusive events.
3. Define joint probability?
The chance of two things happening together called joint probability.
4. What is conditional probability?
The chance of something happening, given another thing has already happened.
5. What is significance level?
It’s the level that tells us whether a result is important or not in a test.
6. Explain the meaning of P(A)=0 and P(A)=1?
Explain: P(A)= 0: It cannot happen and P(A)= 1: It will happen for sure.
7. What is probability tree?
A probability tree is a diagram that shows all possible outcomes of an event and their chances.
8. When events are called equally likely events?
When all events have the same chance it’s called equally likely events
9. What is random variable?
A random variable is a number that can be different each time you do something randomly, like the result of a dice roll.
10. What is binomial distribution?
It is a way to find the probability of getting a certain number of successes in a fixed number of tries.
11. What is marginal probability?
Marginal probability is the chance of one event happening ignoring other.
12. What is combination?
Combination is choosing items from a group where the order doesn’t matter.
13. What is the variance of binomial distribution?
It is np(1-p) where n is tries, p is success chance.
14.What is meant by event?
An event is something that can happen, like getting heads in a coin flip.
15. What is the highest value of a probability of an event?
The highest value is 1, meaning the event is sure to happen.
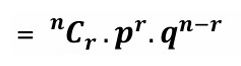
16. What is the probability function of binomial distribution?
Function of binomial distribution
1.What is Index?
An index is a list or Process that can provide information quickly.
2. What is index number?
An index number shows changes in a value, like price or quantity, over time.
3. What is price index?
A price index measures the change in prices of goods and services over time.
4. What is consumer price index number?
The consumer price index (CPI) measures the change in prices of items that people buy for daily use.
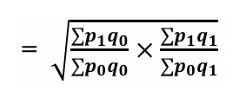
5. Write down Fisher’s price index formula.
Fisher’s price index formula is:
6. What is chain index?
A chain index measures changes over time by linking index numbers from one period to the next.
7. What is quantity index?
A quantity index shows changes in the quantity of goods over time.
8. Under what condition is the time reversal test satisfied?
The time reversal test is satisfied when reversing time gives the same index value.
9. Under what condition is the factor reversal test satisfied?
The factor reversal test is satisfied when multiplying the price and quantity index gives the value of total change.
10. Which index number is ideal?
Fisher’s index is considered the ideal index.
11. What is the ideal index?
The ideal index satisfies both the time reversal and factor reversal tests, like Fisher’s index.
Chapter-01: Introduction
Chapter-02: Central Tendency
Chapter-03: Measure of dispersion
Chapter-04: Correlation & Regression Analysis
Chapter-05: Probability & Probability Distribution
1. What is probability?
It is the chance of something happening. It can be between 1(possible) and 0(impossible).
2. What are mutual exclusive events?
We can’t get both heads and tails in one times its called mutual exclusive events.
3. Define joint probability?
The chance of two things happening together called joint probability.
4. What is conditional probability?
The chance of something happening, given another thing has already happened.
5. What is significance level?
It’s the level that tells us whether a result is important or not in a test.
6. Explain the meaning of P(A)=0 and P(A)=1?
Explain: P(A)= 0: It cannot happen and P(A)= 1: It will happen for sure.
7. What is probability tree?
A probability tree is a diagram that shows all possible outcomes of an event and their chances.
8. When events are called equally likely events?
When all events have the same chance it’s called equally likely events
9. What is random variable?
A random variable is a number that can be different each time you do something randomly, like the result of a dice roll.
10. What is binomial distribution?
It is a way to find the probability of getting a certain number of successes in a fixed number of tries.
11. What is marginal probability?
Marginal probability is the chance of one event happening ignoring other.
12. What is combination?
Combination is choosing items from a group where the order doesn’t matter.
13. What is the variance of binomial distribution?
It is np(1-p) where n is tries, p is success chance.
14.What is meant by event?
An event is something that can happen, like getting heads in a coin flip.
15. What is the highest value of a probability of an event?
The highest value is 1, meaning the event is sure to happen.
16. What is the probability function of binomial distribution?
Function of binomial distribution
Chapter-06: Sampling & Hypothesis
Chapter-07: Index Number
1.What is Index?
An index is a list or Process that can provide information quickly.
2. What is index number?
An index number shows changes in a value, like price or quantity, over time.
3. What is price index?
A price index measures the change in prices of goods and services over time.
4. What is consumer price index number?
The consumer price index (CPI) measures the change in prices of items that people buy for daily use.
5. Write down Fisher’s price index formula.
Fisher’s price index formula is:
6. What is chain index?
A chain index measures changes over time by linking index numbers from one period to the next.
7. What is quantity index?
A quantity index shows changes in the quantity of goods over time.
8. Under what condition is the time reversal test satisfied?
The time reversal test is satisfied when reversing time gives the same index value.
9. Under what condition is the factor reversal test satisfied?
The factor reversal test is satisfied when multiplying the price and quantity index gives the value of total change.
10. Which index number is ideal?
Fisher’s index is considered the ideal index.
11. What is the ideal index?
The ideal index satisfies both the time reversal and factor reversal tests, like Fisher’s index.